Structure and Demarcation
Euro-Climhist is based on written or pictorially documented weather observations, on (early) instrument measurements and on "proxy data" from the High Middle Ages to the present day. Some of the long series go back as far as the 15th century, allowing information on temperature, precipitation and phenological phenomena to be compared over the centuries. Image sources on the state of glaciers over the centuries illustrate their growth and shrinkage. Euro-Climhist currently contains around 440,000 data on pan-European weather conditions, 235,000 data on Switzerland and 205,000 data on various European countries, such as today's Czech Republic, France, Spain, England, Sweden, the Baltic States and other countries (as of January 2024). The regions covered by detailed data are set to grow continuously on the basis of international cooperation projects. All these data provide information on weather events and their consequences for humans and the environment, with the focus for Switzerland being on the period between 1501 and 1863, i.e. until the start of continuous nationwide instrument measurements in the network of today's MeteoSwiss in 1864. Due to current regulations, daily measurements for Switzerland from 1864 onwards are only accessible on request via the historic measured meteorological data from MeteoSwiss. Swiss data from the Middle Ages (up to 1500) is currently being gradually integrated, as well as selected weather data from 1864 onwards, such as summarised monthly reports or information on extreme natural events.
Content Differentiation from other Databases
Data that has already been professionally collected in other contexts should deliberately not be duplicated in Euro-Climhist. The following overview therefore links to some of the most important resources for Switzerland and Europe.
a) Switzerland
For floods and landslides since 1972, the Swiss Federal Institute for Forest, Snow and Landscape Research (WSL) has compiled the Swiss Flood and Landslide Damage Database, which is available to public institutions on request (Hilker, Badoux, Hegg 2009). Data on avalanches are collected by the WSL Institute for Snow and Avalanche Research SLF in Davos for the period from the 1930s onwards. Access to this database is subject to a charge. Data on storms can be found in the Swiss Storm Archive, which goes back into the past in keyword form, but does not provide any source texts or references. It is also only available in German. Damage events in the later 20th century are therefore - in contrast to Euro-Climhist - recorded in different databases, which go back different lengths of time and are provided with different levels of references. Consequently, there are gaps between the data recorded in Euro-Climhist and the beginning of the WSL and SLF databases, which are to be closed in the medium term.
b) Europe
In many respects, the data in Euro-Climhist complements and confirms the results of the Tambora data platform, which was set up under the direction of Prof Dr Rüdiger Glaser at the University of Freiburg im Breisgau. Tambora is a "collaborative research environment focussing on questions of climate reconstruction and environmental change, the impact on (historical) societies and their coping strategies". The Euro-Climhist approach also emphasises a strict distinction between contemporary, mostly reliable sources and non-contemporary, second-rate sources. It also allows the integration of images and graphics. For the British Isles, TEMPEST, a separate climate history database with a focus on extreme weather events, was launched under the direction of Prof Dr Georgina Endfield (University of Liverpool, previously University of Nottingham).
Euro-Climhist by Location
a) Europe
At European level, a distinction must be made between pan-European overview data, such as the daily weather maps from 1763 (27.6%), which go back to the dissertation by Mikhaël Schwander (Geneva) (Schwander et al. 2017), and detailed information on individual countries. Much of this data comes from cooperation partners. In this way, only a selection of regions is currently available in detail, such as the Czech Republic, Sweden, Estonia, several regions of France and England or Catalonia; at least some serial weather data exists for countries such as the Netherlands, Luxembourg or Ireland. The number of data varies depending on the type of source: daily weather data results in a much higher number than information on extreme events. The proportion of data for Switzerland (62.7%) is still very high due to the history of Euro-Climhist.

b) Switzerland
As of January 2024, most of the data for Switzerland comes from the cantons of Graubünden, Ticino and Valais (24.3%), followed by Bern and Lucerne (21.0%), north-eastern Switzerland (19.3%), north-western Switzerland (11.1%) and French-speaking Switzerland (8.8%). This again reflects the numerical weight of the daily observations and the long series. Central Switzerland (1.4%) mainly reports natural disasters. If the observations concern entire valleys, bodies of water, glaciers, passes and mountains or larger regions (14.1%), these cannot generally be assigned to a single canton. They appear in the query under their name in their own regional categories or when searching via a commune located in this area, not via one of the cantons concerned. Reports from neighbouring countries about Switzerland (< 1%) are rare, but important, as they often concern phenomena that have not been observed in Switzerland itself, or have been observed insufficiently. In terms of demographic, economic and cultural importance, the cantons of Vaud and Fribourg receive remarkably little data.

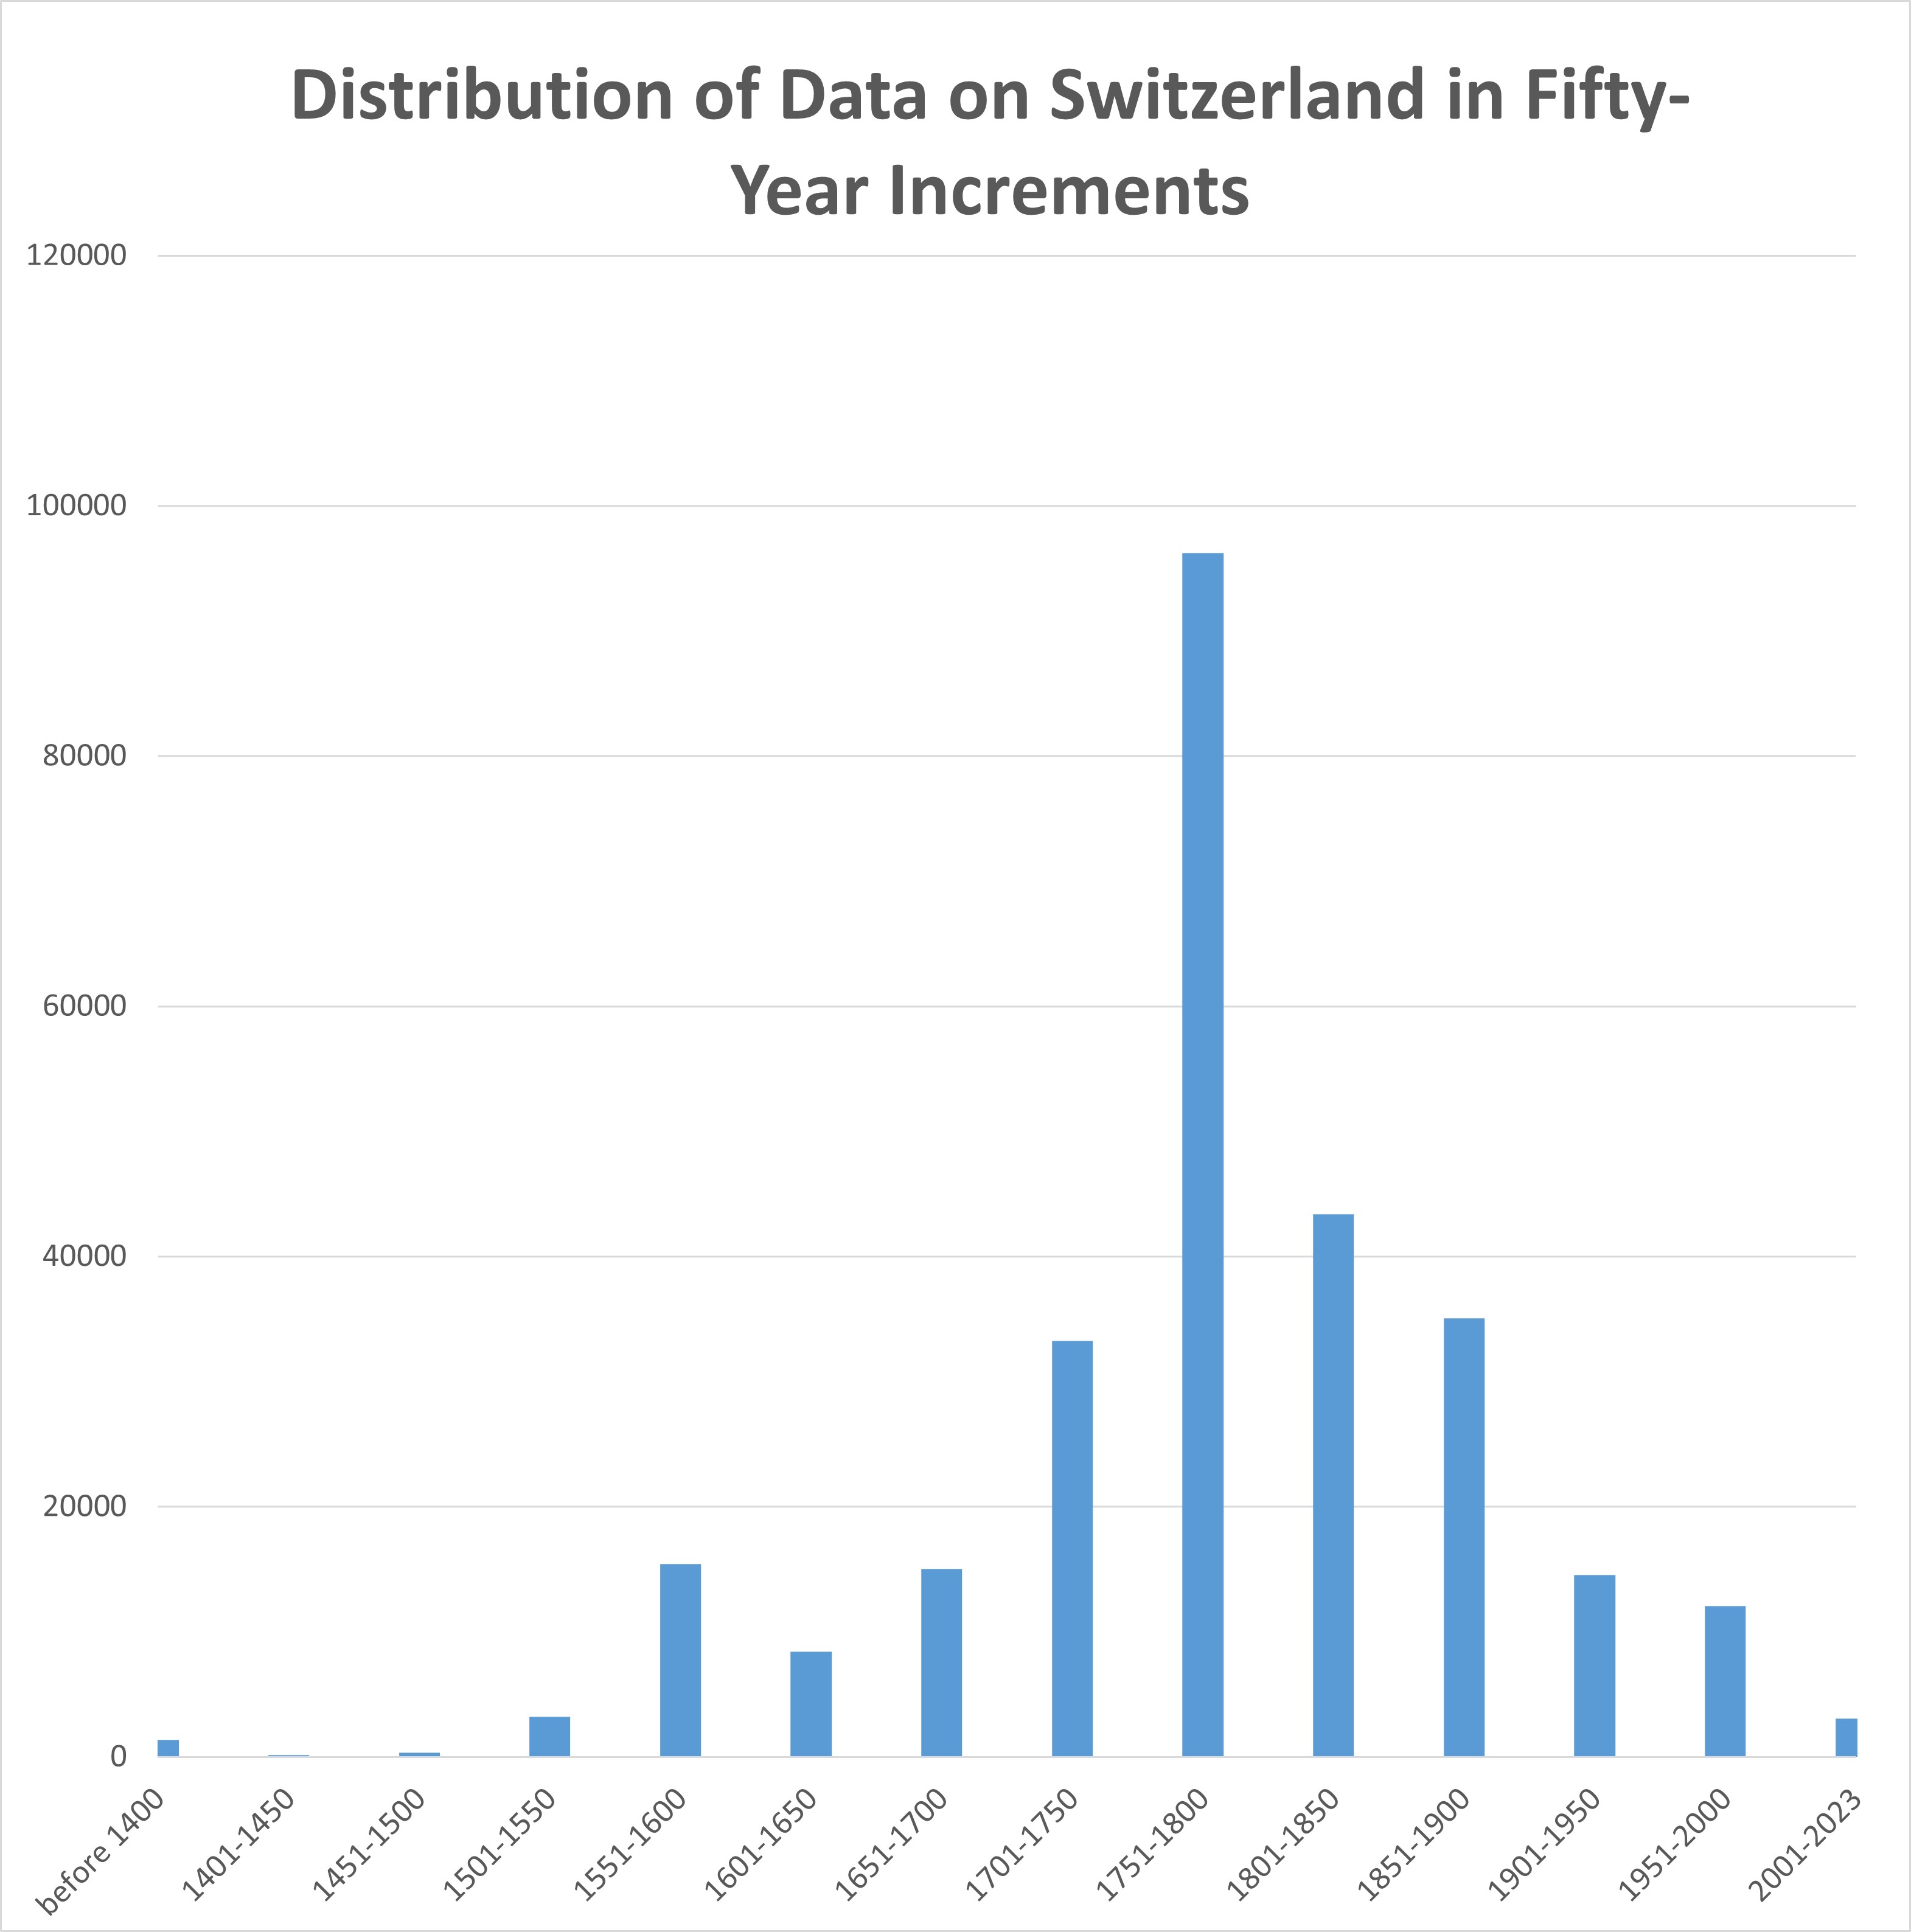
Euro-Climhist after Fifty-Year Periods
The numerical significance of the daily observations, the long measurement series and the serial weather data becomes particularly clear when looking at the temporal development of the data volume by fifty-year periods. However, there is a clear difference between pan-European data on the one hand and data for Switzerland on the other. The pan-European data is available for the period from 1763 onwards, includes one weather map per day and thus remains constant in terms of numbers from the 19th century onwards. Although some of the data for individual European countries is available at a very early date, the instrumental measurement data from the late 18th century onwards is particularly significant in terms of numbers. For Switzerland, on the other hand, only a few long series are available for the period after 1900; instrumental daily measurements from 1864 onwards are only accessible on request via the historic measured meteorological data from MeteoSwiss due to current regulations. The data from the periods before 1400, 1401-1450, 1451-1500 and 1500-1549 are still incomplete, and to a lesser extent those from the period 1600-1649.

Euro-Climhist by Category
a) Switzerland
Daily weather observations make up the lion's share for Switzerland with 66.44%. Measurement series and serial weather data are in second place with 23.04%. This is followed by plant and animal phenological data (6.06%), temperature and precipitation indices (2.71%) and economic data (e.g. size of grain varieties, grape and fruit harvests, grain prices, etc.) with 1.2%. Weather damage and natural hazards (0.51%) and socio-political data (0.03%) make up a small proportion.

b) Europe
The composition of the data for Europe as a whole, including Switzerland, is somewhat different: daily weather observations account for 46%, measurement series and serial weather data for 45.1%. This is followed by proxy data (5.4%), temperature and precipitation indices (1.9%) and economic data (1.1%). Natural hazards and damage (0.4%) and socio-political data (0.1%) make up a small proportion.

Long Rows
The following observation variables are available in the form of long series:
a) Descriptive weather observations (10 series)
- Descriptive weather observations are available for various Swiss cities, as well as monthly weather reports for 1764-1790 and 1820-1912 as overview information. The monthly weather reports of today's MeteoSwiss and its predecessor institutions (1861-1999), which were previously only available in print, have been digitised for Euro-Climhist and are currently available up to 1912. From 2000 onwards, the monthly climate reports are available on the MeteoSwiss homepage. For the period between 1878 and 1881, only measurements were published, even in the press, because at that time only numerical series were fashionable in meteorology. This is why there are no descriptive reports for these four years. In addition, private individuals wrote regional monthly weather reports for the periods 1764 to 1790 and 1820 to 1860.
b) Instrumental measurement series and reconstructed temperature and precipitation patterns (70 series)
- Measurement series of monthly, seasonal and annual mean temperatures in °C are available for Neuchâtel-Geneva (from 1753), Basel (from 1755), the Great St Bernard (1819-1960) and the Swiss Plateau as a whole. On an international level, the reconstructed or measured temperature series for Paris (from 1658), Barcelona (from 1780) and Stockholm (from 1502) are particularly outstanding. For the east of England (Norwich), a long temperature series exists for late spring and early summer (April to July) even from the late Middle Ages (1264-1431).
- Monthly, seasonal and annual precipitation values are also available for the same Swiss cities and regions. For Lucerne, these begin as early as 1579, but then break off after 1613; the Zurich data are available - with interruptions - from 1684; the other series begin in the course of the 18th or early 19th century.
- Data on European weather conditions from 1763 onwards are also recorded in the form of long series, i.e. in this way comparisons can be made over almost 350 years on the monthly or seasonal frequency of certain weather conditions.
c) Proxy data (46 series)
- Several series concern wild plants, specifically the hazel bush and the leaf development of horse chestnut and beech trees. The Geneva series from 1808 onwards (according to Stoller, Beer 1994 and the website "Le Marronnier de la Treille") is based on the so-called "Marronnier officiel", but the leaf unfolding in Geneva has been distorted by the massive warming in the city in recent decades.
- Phenological series on cultivated plants are much more numerous. In many places, not only the harvest dates were recorded for cereals and vines, but also various other growth phases, which allow conclusions to be drawn about the weather in certain months or seasons. The quantity and quality of wine must are also indirect indicators of the climate. In addition, there are series on the blossoming of cherry and pear trees; this date essentially depends on the temperatures in March and April (series according to Rutishauser, Studer 2007). The series refer to numerous locations in Switzerland, grape harvest dates and information on wine must yields, but also to eastern France, Luxembourg, southern Germany and the Czech Republic. They sometimes go back a long way: the series on grape harvest data from Beaune in Burgundy even spans more than 650 years (1354-2018).
- Most of the series on snow cover and the icing of bodies of water relate to Switzerland, but there is also a series on the duration of the icing of canals in the Netherlands (1539-1839). The extent and duration of icing essentially depend on the temperatures in the preceding weeks in late autumn and winter.
- For a long-term comparison, two series of tree-ring data from the Lötschental in the Swiss canton of Valais were also included, starting as early as 755 (series after Büntgen et al. 2006). The findings on tree-ring widths (data in mm) depend in part on the temperatures from June to August, those on tree-ring densities (data in g/cm3) on the temperatures from June to September.
- Dates are usually given in the form "day from New Year".
d) Economic data (7 rows)
- Grain prices depend on various factors. The size of the harvest - mainly due to weather conditions - is only one of them. The Zurich series on spelt prices goes back to 1540, the one on rye prices in Nuremberg even to 1339, and economic history data on wine must harvests are also available over several centuries (1529-1966). The deviation from the long-term trend is also recorded.
e) Pfister indices (4 series)
- Pfister temperature indices for Switzerland, i.e. the estimated order of magnitude of the seasonal and monthly mean temperature, are available for the period between 1550 and 1863.
- Similarly, the seasonal and monthly mean precipitation in Switzerland can also be compared over the long term using the Pfister precipitation indices for 1550-1863.